2016 was the apathy election
In the wake of the 2016 elections, pundits are poring through the exit polls to tease out the preferences of various key identitarian demographics. As I’ve noted in the past, however, these analyses almost invariably leave out a significant preference in American politics: the preference not to vote for either major candidate. If we hope to gain some kind of insight into how various groups think about American politics, we have to take into account the possibility that they may simply not care whether one candidate or the other wins. For that reason, I’ve been digging through the numbers and am going to break them down here into four main groups: gender, race, age, and income.*

From 2012 to 2016, both men and women went from caring about the outcome to not caring. Among Democratic men and women, as well as Republican women, care levels dropped about 3-4 points; Republican men cared a little less too, but only by one point. Across the board, in any case, the plurality of voters simply didn’t care.

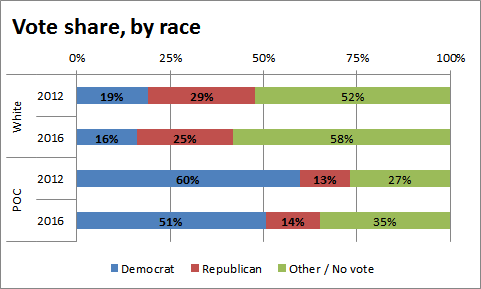
White voters cared even less in 2016 then in 2012, when they also didn’t care; most of that apathy came from white Republicans compared to white Democrats, who dropped off a little less. Voters of color, in contrast, continued to care – but their care levels dropped even more, by 8 points (compared to the 6 point drop-off among white voters). Incredibly, that drop was driven entirely by a 9 point drop among Democratic voters of color which left Democrats with only slim majority 51% support; Republicans, meanwhile, actually gained support among people of color.

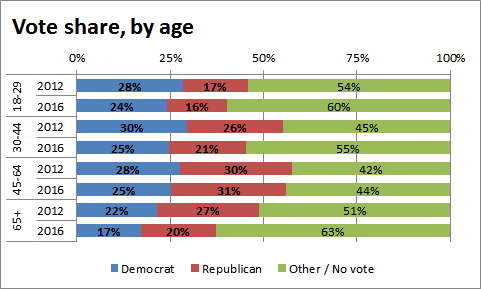
The story when we break down the vote by age is more complicated, though across the board everyone cared less about the outcome than they did in 2012. Care levels dropped most dramatically among the elderly (-12) and Gen-Xers (-10), who went from caring to not caring this year. Neither of those drops was significantly inflected by party. Boomers, predictably, were the only age demographic who continued to care, and were also the only age demographic where support for Republicans increased; support for Democrats, meanwhile, dropped by 3 points. Millennial care levels also dropped significantly, driven mostly by disinterest in the Democrat (though they also cared less about the Republican, too).

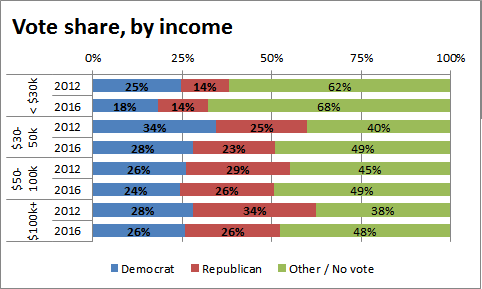
Again, the same pattern holds: everyone cared less this time around. Here, deterioration of support is clearly driven by class. Among poorer demographics, Republicans mostly held the line, while Clinton only had minor losses among richer demographics. The big hit for Clinton came among the lower two brackets (losing 7 and 6 points, respectively), while the big hit for Trump came among the rich (-8).
The major trend in 2016 was one of increasingly apathy. Within that broader trend, the demographic patterns are muddy. Deviations in relatively support from group to group don’t map well onto the standard media narratives that dominated this election; for example, apathy grew more among women and voters of color than among men and white voters. Among the candidates, Clinton either broke even or lost support among every single demographic group, while Trump won support among voters of color and boomers.
Ultimately, Trump managed to stem his losses among men, the poor, and millennials – and among boomers and voters of color he actually improved the GOP’s numbers. Clinton, meanwhile, lost voters in every demographic across the board; she took major hits among voters of color and the poor, and only managed to minimize her losses among wealthier voters. Trump took his largest hit among those same wealthiest voters, but it turns out that pandering to the rich while abandoning the poor just isn’t a winning strategy.
* All numbers are based on Edison exit polling cross-referenced with total population numbers from the US Census.

Carl Beijer is a writer who focuses on the Left, linguistics, and international affairs.

